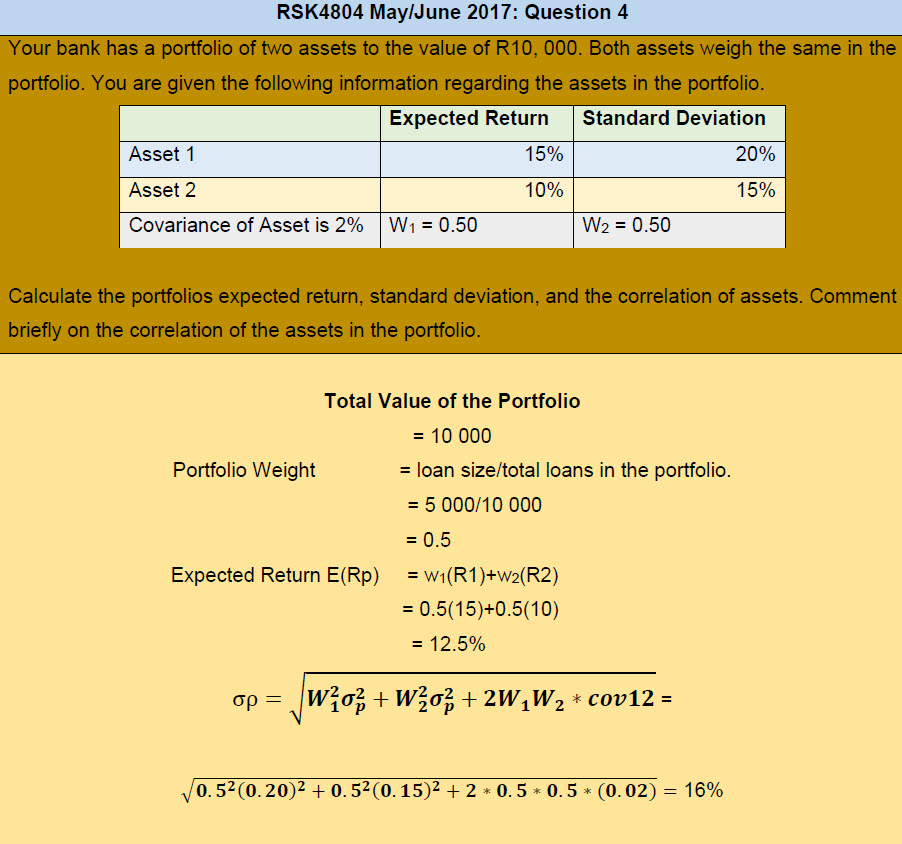
Your bank has a portfolio of two assets to the value of R10, 000. Both assets weigh the same in the portfolio. You are given the following information regarding the assets in the portfolio.
Calculate the portfolios expected return, standard deviation, and the correlation of assets. Comment briefly on the correlation of the assets in the portfolio.

Correlation of the assets in the portfolio
Further summary information can be used to calculate the degree of harmony in the movement of the two shares. When considering a single share, we employed the square root of its variation or standard deviation. We utilize the covariance for two shares, which is frequently stated in a standardized form as the correlation coefficient. This statistic quantifies the degree to which two variables move in the same direction. Correlation coefficients range from +1 (perfect positive correlation) to –1 (perfect negative correlation). Take note that the correlation coefficient is a very positive 0.978. Although the covariance measures the degree to which returns on two risky assets move in tandem, it does not explain the strength of the relationship, which is then measured by the correlation coefficient.
A correlation coefficient of 0 shows that the two variables are unrelated. When P and Q move in near-perfect synchronization, a near-perfect positive correlation exists. In practice, this event would be extremely rare.
